Hello world! This week in advanced statistics we covered tabular data. For our first question, we were to convert a given data frame into a table. This is the R code I used for my answer:
# Loads data.table package
library("data.table")
# Creates assignment_data dataframe
assignment_data <- data.frame(Country = c("France","Spain","Germany","Spain","Germany",
"France","Spain","France","Germany","France"),
age = c(44,27,30,38,40,35,52,48,45,37),
salary = c(6000,5000,7000,4000,8000),
Purchased=c("No","Yes","No","No","Yes", "Yes",
"No","Yes","No","Yes"))
# Converts dataframe to table
setDT(assignment_data)
#Prints Table
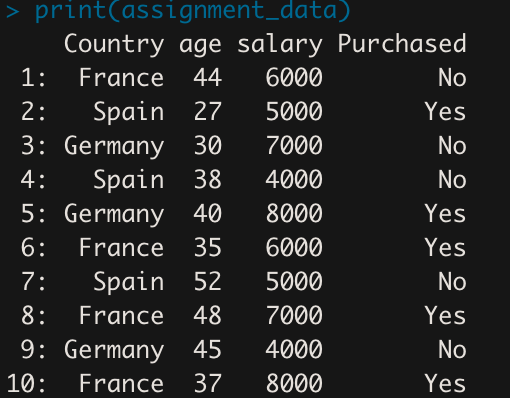
print(assignment_data)
And here’s our beautiful table!
Our second question is as follows:
2. Generate contingency table also know as rx C table using mtcars
2.1 Add the addmargins() function to report on the sum totals of the rows and columns of assignment9 table
2.2 Add prop.tables() function, and report on the proportional weight of each value in a assignment9 table
2.3 Add margin = 1 to the argument under prop.table() function, and report on the row proportions found in assignment9 table.
Heres the R code I used for this question:
# Creates table called assignment9
assignment9 <- table(mtcars$gear, mtcars$cyl, dnn=c("gears"))

# Print sum of rows and columns in assignment9
addmargins(assignment9)

# Returns table proportions
prop.table(assignment9)

# Returns table proportions by row
prop.table(assignment9, margin = 1)
And here is what the console returns when the code is run:
> # Creates table called assignment9
> assignment9 <- table(mtcars$gear, mtcars$cyl, dnn=c("gears"))
> # Print sum of rows and columns in assignment9
> addmargins(assignment9)
     NA
gears  4  6  8 Sum
  3    1  2 12  15
  4    8  4  0  12
  5    2  1  2   5
  Sum 11  7 14  32
> # Returns table proportions
> prop.table(assignment9)
     NA
gears       4       6       8
    3 0.03125 0.06250 0.37500
    4 0.25000 0.12500 0.00000
    5 0.06250 0.03125 0.06250
> # Returns table proportions by row
> prop.table(assignment9, margin = 1)
     NA
gears          4          6          8
    3 0.06666667 0.13333333 0.80000000
    4 0.66666667 0.33333333 0.00000000
    5 0.40000000 0.20000000 0.40000000
Very straightforward work this week! Enjoy Halloween this coming weekend, and I’ll see you soon!
