This week in advanced statistics, we covered hypothesis testing and correlation analysis. We were assigned three questions to answer, which read as follows:
The director of manufacturing at a cookie factory needs to determine whether a new machine is producing a particular type of cookie according to the manufacturer’s specifications, which indicate that cookies should have a mean of 70 and standard deviation of 3.5 pounds. A sample of 49 cookies reveals a sample mean breaking strength of 69.1 pounds.
A. State the null and alternative hypothesis.
B. Is there evidence that the machine is not meeting the manufacturer’s specifications for average strength? Use a 0.05 level of significance.
C. Compute the p value and interpret its meaning.
D. What would be your answer in (B) if the standard deviation were specified as 1.75 pounds?
E. What would be your answer in (B) if the sample mean were 69 pounds and the standard deviation is 3.5 pounds?
For question A, the null hypothesis is μ = 70 and the alternative hypothesis is μ ≠ 70. To determine whether or not the machine is meeting the manufacturer’s specifications for average strength, I will be conducting a two-tailed test. There is not significant evidence to reject H0. The p-value of this is 0.07186, which is not significant as p is not less than the significance level of 0.05, which means the sample meets manufacturing standards. Redoing part B with a standard deviation of 1.75 causes us to reject H0, as the p value produced is less than the significance level 0.05. Redoing part B with a sample mean of 69 pounds and a standard deviation of 3.5 pounds produces a z score of -2 and a p value of 0.0456, causing H0 to be rejected. Second Question:If x̅ = 85, σ = standard deviation = 8, and n=64, set up 95% confidence interval estimate of the population mean μ.
The confidence interval estimate of the population mean would be (83.04, 86.96). The accompanying data are: x= girls and y =boys. (goals, time spend on assignment)
a. Calculate the correlation coefficient for this data set _____
b. Pearson correlation coefficient _____
c. Create plot of the correlation
For this question, I used the following R code:
library(“lsr”)
library(“corrgram”)
x <- data.frame( cbind(Goals = c(4,5,6),
#Grades = c(“49″,”50″,”69”),
# Popular = c(“24”, “36”, “38”),
Time_on_assignment = c(92, 108, 135)
#Total = c(“92″,”108″,”135”)
)
)
y <- data.frame(cbind(Goals = c(4,5,6),
#Grades = c(“46.1″,”54.2″,”67.7”),
#Popular = c(“26.9”, “31.6”, “39.5”),
Time_on_assignment = c(18.9, 22.2, 27.8))
#Total = c(“95.9”, “113”, “141”))
)
girl_goals <- as.matrix(x$Goals)
boy_goals <- as.matrix(y$Goals)
girl_time <- as.matrix(x$Time_on_assignment)
boy_time <- as.matrix(y$Time_on_assignment)
cor(x = girl_goals, y = boy_goals)
cor(x = girl_time, y = boy_time)
cor(x = girl_goals, y = boy_goals, method = “pearson”)
cor(x = girl_time, y = boy_time, method = “pearson”)
cor(x = girl_goals, y = boy_goals, method = “spearman”)
cor(x = girl_time, y = boy_time, method = “spearman”)
goals <- data.frame(girl_goals, boy_goals)
plot(girl_goals, boy_goals)
plot(girl_time, boy_time)
These are the produced plots: 
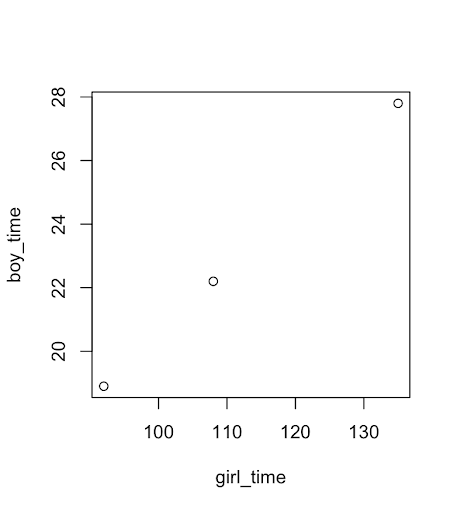
The Pearson correlation coefficient for goals is 1 and time is 0.9999989, and the Spearman correlation coefficient for both goals and time is 1.
